EPoX EP-9U1697-GLi: ULi M1697 Goes Mainstream
by Gary Key on March 15, 2006 12:05 AM EST- Posted in
- Motherboards
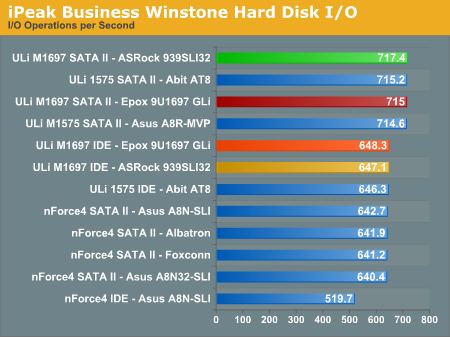
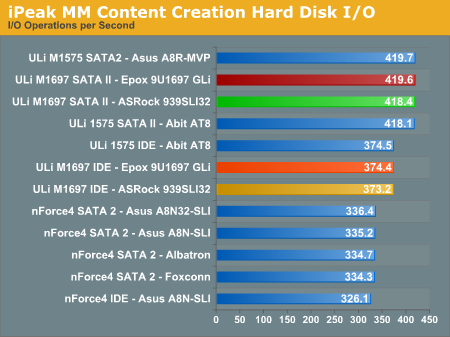
Disk Controller Performance
With the variety of disk drive benchmarks available, we needed a means of comparing the true performance of the wide selection of controllers. The logical choice was Anand's storage benchmark first described in Q2 2004 Desktop Hard Drive Comparison: WD Raptor vs. the World. The iPeak test was designed to measure "pure" hard disk performance, and in this case, we kept the hard drive as consistent as possible while varying the hard drive controller. The idea is to measure the performance of a hard drive controller with a consistent hard drive.
We played back Anand's raw files that recorded I/O operations when running a real world benchmark - the entire Winstone 2004 suite. Intel's iPEAK utility was then used to play back the trace file of all IO operations that took place during a single run of Business Winstone 2004 and MCC Winstone 2004. To try to isolate performance differences to the controllers that we were testing, we used the Maxtor MaXLine III 7L300S0 300GB 7200 RPM SATA drive in all tests . The drive was formatted before each test run and a composite average of 5 tests on each controller interface was tabulated in order to ensure consistency in the benchmark.
iPeak gives a mean service time in milliseconds; in other words, the average time that each drive took to fulfill each IO operation. In order to make the data more understandable, we report the scores as an average number of IO operations per second so that higher scores translate into better performance. This number is meaningless as far as hard disk performance is concerned, as it is just the number of IO operations completed in a second. However, the scores are useful for comparing "pure" performance of the storage controllers in this case.


35 Comments
View All Comments
Spoelie - Wednesday, March 15, 2006 - link
Another very small quirk: page 7 3rd graph shows latency - lower is better - but the boards are still ordered like higher is better..Spoelie - Wednesday, March 15, 2006 - link
hmm and apparantly all the audio utilization graphs as well :) And since we're still at it, since for storage performance differs only from southbridge to southbridge and not from board to board, it might ease up those graphs to just display one representative for each + the board in review.Rock Hydra - Wednesday, March 15, 2006 - link
Er sorry, forgot to mention you said DDR2.Googer - Wednesday, March 15, 2006 - link
Here is another just released review on this same motherboard:http://www.ocworkbench.com/ocwbcgi/newspro/viewnew...">http://www.ocworkbench.com/ocwbcgi/newspro/viewnew...,
Gary Key - Wednesday, March 15, 2006 - link
Sorry about that, corrected. :)